


Data visualization is an essential tool in the modern world of data-driven decision-making. As a content writer and blogger with five years of experience, I've seen firsthand the impact that compelling data visualizations can have on conveying complex information in an easily digestible manner. In this blog, we will dive into the world of data visualization and explore the power of D3.js, a JavaScript library that allows you to create stunning and interactive charts and maps. Get ready to unlock the potential of your data through captivating visualizations!
Why Data Visualization Matters 📊
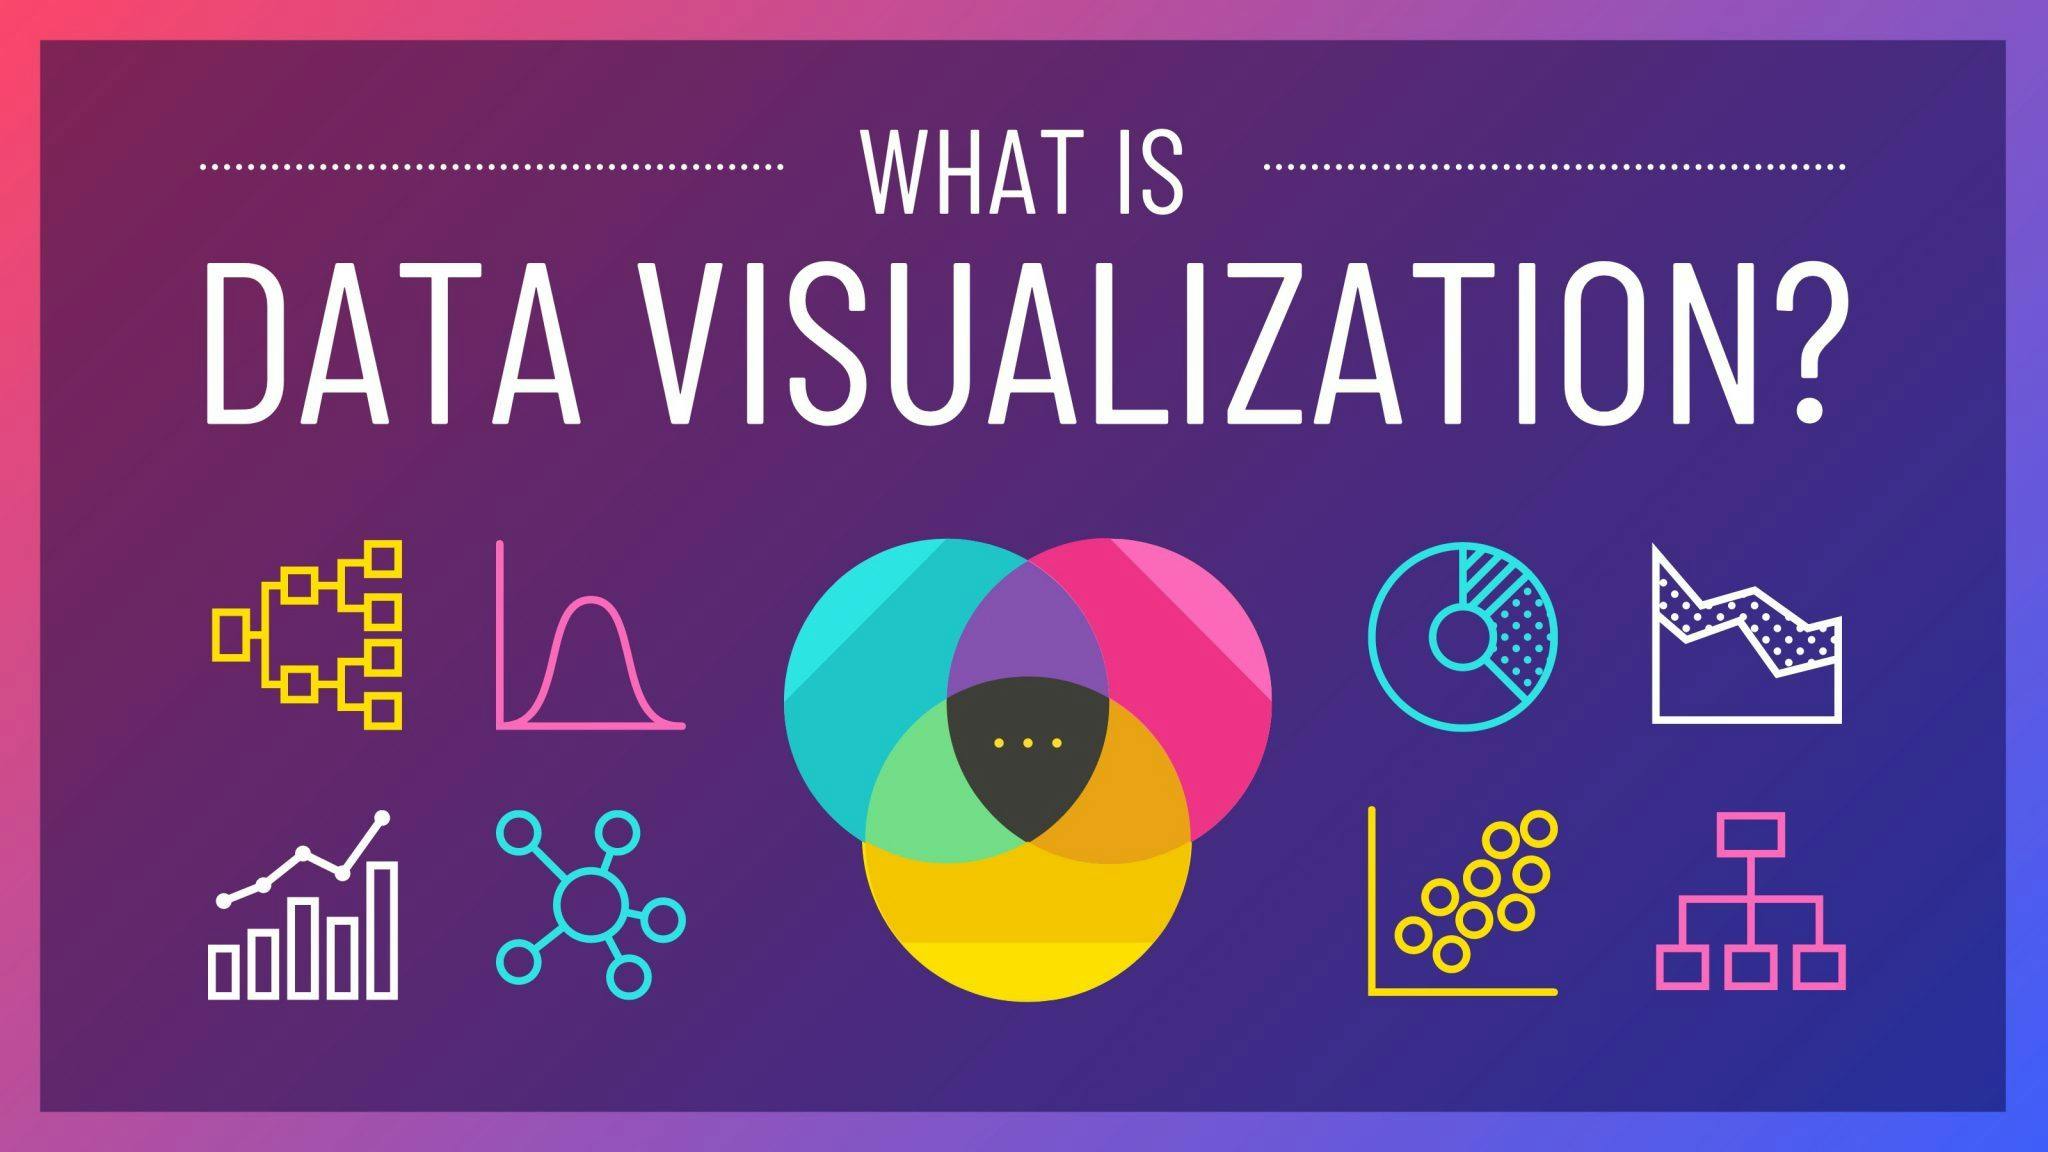
Before we dive into D3.js, let's take a moment to understand why data visualization is crucial. In our data-rich world, making sense of vast amounts of information can be overwhelming. That's where data visualization comes in. By transforming raw data into visual representations, we can:
🔸 Simplify Complexity: Data visualizations simplify complex datasets, making it easier for stakeholders to grasp key insights quickly.
🔸 Spot Trends: Visualizations help us identify trends, patterns, and outliers that might otherwise go unnoticed.
🔸 Support Decision-Making: Visual data aids in making informed decisions, whether in business, healthcare, or research.
Introducing D3.js 🚀

Now, let's meet D3.js, which stands for Data-Driven Documents. D3.js is a powerful JavaScript library that enables you to create dynamic, interactive, and visually appealing data visualizations. Here's why D3.js is a favorite among data enthusiasts:
🔸 Flexibility: D3.js gives you complete control over your visualizations, allowing you to customize every aspect.
🔸 Wide Range of Options: It supports various chart types, from simple bar graphs to complex interactive maps.
🔸 Integration with Data: D3.js seamlessly integrates data from various sources, making it easy to update visualizations with new information.
Getting Started with D3.js 🏁
Before you start creating stunning data visualizations with D3.js, you'll need to set up your development environment. Here are the essential steps:
Install D3.js: Begin by including the D3.js library in your project. You can either download it or link to it via a content delivery network (CDN).
<script src="https://d3js.org/d3.v7.min.js"></script>Prepare Your Data: Organize your data in a format that D3.js can understand, such as JSON or CSV.
Create an SVG Container: D3.js renders visualizations within SVG (Scalable Vector Graphics) elements. Create an SVG container where your visualization will reside.
 const svg = d3.select("#visualization-container")
     .append("svg")
     .attr("width", width)
     .attr("height", height);
Building Your First Visualization 📈
Let's take a practical example to create a simple bar chart using D3.js. We'll use a dataset of monthly sales figures.
Load Data: Import your data into your script.
 d3.csv("sales_data.csv").then(function(data) {
     // Your code here
 });
Scale your Data: Set up scales to map your data to the SVG canvas.
 const xScale = d3.scaleBand()
     .domain(data.map(d => d.month))
     .range([0, width])
     .padding(0.1);

 const yScale = d3.scaleLinear()
     .domain([0, d3.max(data, d => d.sales)])
     .range([height, 0]);
Create Bars: Generate the bars based on your data.
 svg.selectAll(".bar")
     .data(data)
     .enter()
     .append("rect")
     .attr("class", "bar")
     .attr("x", d => xScale(d.month))
     .attr("y", d => yScale(d.sales))
     .attr("width", xScale.bandwidth())
     .attr("height", d => height - yScale(d.sales));
Interactivity: You can add interactivity by handling events like mouseover and mouseout.
 svg.selectAll(".bar")
     .on("mouseover", function(d) {
         // Display additional information on hover
     })
     .on("mouseout", function(d) {
         // Remove additional information on mouseout
     });
Going Beyond: Interactive Maps 🗺️
While bar charts are a great start, D3.js can do much more. You can create interactive maps with geoJSON data and various map projections. Imagine visualizing geographic data with zoom and pan capabilities!

To create an interactive map with D3.js, you'll need to:
Load GeoJSON Data: Obtain geoJSON data for the map you want to create. This data includes information about geographic features.
Set Up Projections: D3.js offers different map projections for rendering geographic data accurately. Choose the one that suits your needs.
Create Paths: Use D3.js to generate paths for the geographic features in your map.
Add Interactivity: Implement zooming, panning, and tooltips to enhance the user experience.
Conclusion 🎉
In this blog, we've explored the world of data visualization and the power of D3.js. With D3.js, you have the tools to create stunning and interactive data visualizations that can drive insights and inform decisions.
Remember that practice makes perfect. As you continue to experiment and learn, you'll unlock the full potential of D3.js and be able to craft data visualizations that captivate and inform your audience. So, dive in, get creative, and start visualizing your data like never before!

Data visualization is an art and a science, and with D3.js, you have the perfect canvas to create your masterpieces. Happy visualizing!
📊📈🚀🗺️🎉
Remember, data visualization is a dynamic field, and D3.js is a versatile tool that can help you convey insights effectively. Whether you're a data analyst, a business professional, or a developer, mastering D3.js can take your data storytelling to the next level. So, roll up your sleeves, experiment with various chart types and maps, and let your data shine through captivating visualizations. Happy coding! 📊📈🚀🗺️🎉